How to make data driven decisions


Why should you base business decisions on data?

The McKinsey Global Institute found that "Organisations that make data driven decisions are 23x more likely to acquire new customers.". 23x! That's huge! It really is a no-brainer, this is something you should be doing.
How to go about it
If you're considering switching your business decision making to a data driven approach, it's difficult to know where to start. Getting started can be pretty intimidating.
Luckily, as it turns out, the whole process is actually pretty painless, if you take a stepwise approach:
- Clearly identify your goal
- Gather relevant information.
- Evaluate your options
- Make your choice
- Evaluate the outcome
Let's go through each of these steps:
1. Clearly identify your goal.
This means you have to know what you want. Decide what's important to your business, and set yourself a specific outcome that you'd like to achieve. Chances are, you've already done this step — it's just regular goal setting.
2. Gather relevant information.
Once you know your goal, you need to start gathering relevant information, but where does this information come from?
Your business already generates a huge wealth of data through it's day-to-day operations. If you use any online tools, like CRMs or online sales platforms, you'll already have much of this on tap, likely even including historical data. There are plenty of tools around to help gather your data and funnel it to the right storage mechanism.
You then need to store you data.
Data lake
You never really know what information you're going to find useful down the line — you might have a few specific, well-defined things you know you want to store, and that's great, but the data lake is where you can store everything else — the stuff you haven't figured out what you want to do with yet, or what structure it should be in. Typically, it's a bit slower to get analytics from this type of data.
Data warehouse
Those specifics, that well-defined detail you know you want... that needs to be thought out a little more carefully. That's where a data warehouse comes in. Data that goes in here, is clean & precise, you know how it fits together, how it should be structured, and it's typically faster and easier to get analytics from this data.
Freshness
Making sure your data is up-to-date is critical — it should be as close to realtime as possible. For some things, freshness won't be so important, but for most things, it is.
You might be used to manual reports that require a lot of work to gather information, or take a lot of time to generate.
Those things conspire to make you rely on old data — it's too hard and takes too long to refresh the data-set, so you just rely on last month's, or last years data instead. This can negatively impact your outcomes, since you're making decisions based on data that's less relevant to the current situation.
** Automating your data collection and storage is key to getting accurate, up-to-date results.
EXAMPLE

If your goal is to increase the number of users actively participating in
your events, then you need some way of easily identifying the number of
users you have, and the events they participate in.

But more than that, you'll want to record as much of the information
associated with those users and events as you can. For example:

- Location of signed up users against event locations
- Types of event against users preferences or skills
- What time are the events held
- Event capacity vs number of participants
- What events did the user see when they logged in
- Have users signed up to an event and not attended
- Was the weather relevant? If it might have been, store it!

Now you've got a bunch of data — we need to do something with it!
3. Evaluate your options
First up, we need to figure out how to measure your core objective then, write a list of draft "action plans" you could implement to "move the needle".
Visualise
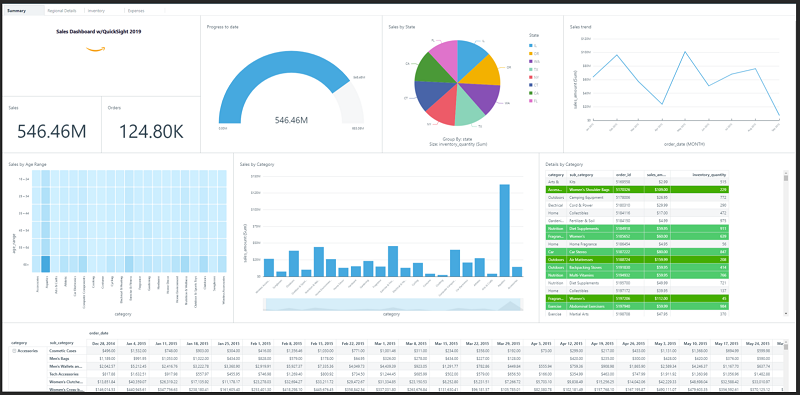
This is easy. There are lots of options, but a great place to start is to use a tool called AWS Quicksight. Quicksight can talk directly to your other software meaning data is up-to-date and completely fresh, whenever you need it.
BACK TO OUR EXAMPLE....

Quicksight could talk directly to an event management system to make the
number of users who have participated in an event visible at any point in
time.

This will be our "key metric" which directly measures our goal of
increasing the number of active users.

However, just showing the total would be what's termed a "vanity metric".

Instead, we'll show how this number has increased over time.

Even better, show the amount you've improved compared to the previous
period. Displaying the information in this way gives us a clear
indication of when we're doing well against our goal, and shows us when
we're moving the needle.
Evaluate
We could leave it here, but that's not really enough: you'd be missing the point. Instead, we can take it a step further, and look at past trends in the data, correlate them to the other data-points you've carefully collected, and predict which of your action plans has the most merit. You may even find a completely new action plan at this point!
You'll need a tool like AWS Quicksight that lets you combine data from different sources, mash it up, and easily look at it in different ways.
4. Make your choice.
Start off with your draft list. For example, you may have noticed that you get more participants when there are active events within a couple of days after a user signs up. Using Quicksight, you could create a chart which shows the time period between when users sign up with the app, and when they attend their first event.
Once you've got that chart, you can slice it in different ways. Group that data by region, or by sector. Combine the groupings. Filter them.
You can use these different visualisations to work out which of your action plans have had the most impact in the past, and this will help guide you to choose an approach.
At this point, you'll be feeling pretty confident in your chosen action plan, and rightly so. You've got the data to back it up. Go ahead and do it!
But be deliberate — you don't want to try too many things at once, otherwise it may be difficult to tell which action was responsible for the impact. It's a good rule of thumb to run a single trial at a time, then add in others once you're confident in your results.
5. Evaluate the outcome
Once you've executed your approach, come back and evaluate the impact. See whether it moved the needle. You've already done the hard work by this point — now you're just referring back to our "key metric" from before.
In Quicksight, you can configure PDF reports be sent to relevant stakeholders automatically each week, or whatever period suits best. This gives you a rolling view of the impact of your changes, delivered to your inbox with no further effort required.
Quicksight is an in-depth tool, and can be fairly complex to set up — it's important to have a technical partner that can help with the configuration. But once it's configured, the recurring reports are invaluable, and different charts can be really easy to configure. If you're a little adventurous, you could even use the configured data sources to pull together a new report, or variations on an existing one.
All going according to plan, you'll have acquired 23x more customers, in no time!

If you need help integrating your data sources, or managing your AWS account please get in touch .